GrantTap field guide · · 15 min read
Why is the agent computer busy? Read processes, CPU, memory and disk
Investigate local load by ownership, interval and useful work. Understand process groups, measured versus attributed use, safe cache cleanup, runtime versions and targeted restarts.

A busy computer can make an agent workflow feel unreliable even when no individual component has failed. Several Node processes appear, a compiler consumes memory, a background indexer wakes up, and a phone waits for an update. The tempting response is to stop everything that looks duplicated. That can interrupt a legitimate build, detach an approval request, or remove the process currently responsible for receiving messages. A more useful approach identifies the work, its owner, its duration, and the evidence that it is no longer needed.
GrantTap exposes parts of this picture through device management and observed resource information. Those views are helpful when their scope and freshness remain clear. This article proposes a method for investigating local load without confusing aggregate rows, shared tools, disposable cache, and retained user work. It does not report a performance benchmark or promise a universal process optimizer. It fills an October editorial date and was prepared and checked against the current product sources on November 5, 2026.
Ask which problem you are trying to solve
High CPU, memory pressure, low disk space, slow message delivery, and an unresponsive provider are different problems. Start with the symptom the person can observe. Is typing delayed? Does the machine become hot while nothing is supposed to run? Is a build failing because the disk is full? Does the phone have only a relay receipt while the computer is asleep? Naming the symptom helps you select the right evidence. A large folder will not explain every CPU spike, and stopping a compiler will not repair an expired provider login. Avoid turning a mixed list of observations into one diagnosis.
Write down when the symptom occurs and what work should be active. A short busy period during a requested build may be expected. A repeated burst while every task is finished deserves a different investigation. Keep the initial record modest: the time, intended work, affected application, and a few relevant process or device observations. You can add detail after identifying a likely owner. This is more effective than repeatedly refreshing every diagnostic screen, which may itself create work. The goal is to explain the original symptom, not to make every number on the workstation as small as possible.

Read a process count as an inventory
Several processes with similar names can have legitimate distinct roles. A coding client may start one MCP server for each chat. A background monitor can maintain connections separately from those short-lived tool sessions. An analysis engine may perform repository work outside the model process. A Node name alone does not tell you which of these roles applies. The process tree, launch time, executable, parent, and associated task are more useful. Treat the count as a starting inventory rather than a verdict that the application has launched the same service many times by mistake.
At the same time, legitimate architecture does not prove that every observed instance is healthy. Look for a process whose owner has ended, a repeated restart, or a long-running activity that no longer corresponds to useful work. Keep that conclusion specific. Two stdio MCP processes attached to two active chats are different from two monitors competing for the same ownership. A responsible cleanup names the redundant role and its evidence. It does not infer redundancy from a shared executable name, nor does it preserve a truly abandoned process just because multiple processes can sometimes be normal.
Check whether the numbers describe the same interval
An instantaneous CPU sample, a short average, and accumulated CPU time cannot be compared directly. Neither can a current resident-memory value and a peak recorded during an earlier build. Before interpreting a change, check what the source measures and when. A process that completed before the last sample may have unknown resource use, even though its tool result remains in the transcript. A high value observed once can motivate another look, but it does not establish a sustained problem. An apparently low later value also does not erase the earlier event or explain its cause.
Apple’s Activity Monitor documentation distinguishes system, user, and idle CPU activity and provides views of activity over time. Use the view appropriate to the question rather than treating one screen as the definitive meaning of every percentage. Different tools may normalize or aggregate values differently. When comparing GrantTap with another monitor, establish whether both refer to the same process set and interval. This article does not supply a conversion formula or claim that the numbers must match exactly. It proposes keeping their definitions visible so that a comparison can support a practical conclusion.
Follow ownership from the task to the process tree
Find the task that requested the work, then follow the available process attribution. A shell can launch a package manager, which launches a compiler, which launches workers. The expensive work may belong to a child rather than to the process named after the coding client. If you stop only the visible parent, the observed effect depends on the environment and how its children are managed. Prefer the product's supported stop or restart scope when it matches the problem, and verify what actually stopped. Process ownership should be an observation you can explain, not a guess based on a familiar name.
GrantTap can report agent-started process groups and, where supported, their associated conversations. That attribution has limits. Some samples are incomplete, some processes cannot be tied reliably to one call, and historical calls may have no direct measurement. Preserve those cases as unknown. If an agent-wide sample is divided among several activities, the attributed share is not a separate exact measurement of each activity. This distinction prevents a neat-looking report from assigning precision it does not possess. It also helps you focus on the process group that actually needs attention instead of blaming whichever chat is currently open.
Avoid counting the same load twice
A grouped row can already include its child processes. Adding that aggregate to each expanded child again inflates the total. The same principle applies when one dashboard lists both a session group and the processes inside it. Before summing, determine whether the rows form independent sets or a hierarchy. A large combined number may be correct, but it should follow from the grouping definition. Do not diagnose a leak from a total created by counting the same memory or CPU contribution twice. The visual indentation and group label are useful clues, while the underlying scope remains the important fact.
Keep shared components in mind as well. One background service may support several conversations, and a build cache can benefit multiple tasks. An allocation method can distribute that cost, but it must remain labelled as allocation rather than direct measurement. For a practical investigation, it is often enough to identify the largest verified process group and observe how it changes when one bounded piece of work completes. That can explain the symptom without producing an artificial per-message accounting system. Prefer a smaller set of well-understood totals to a complete table whose apparent accuracy depends on hidden assumptions.
Observe a short, meaningful baseline
Choose a period in which you know what the computer is supposed to be doing. Let a requested build finish, close a sample task normally, or pause a nonessential operation through its own supported control. Then observe whether the relevant process group becomes quiet. Keep the intervention narrow enough that its effect is interpretable. If you stop five unrelated applications at once, a quieter machine does not identify the culprit. A bounded baseline can reveal whether the load tracks useful work, persists after completion, or recurs on a schedule that deserves further inspection.
There is no universal duration that makes every workload healthy or unhealthy. A repository analysis can legitimately take longer than a small format command. What matters is progress, task scope, and a plausible relation between the work and the resources consumed. If the source supplies timestamps or a progress record, use them. If it does not, keep a simple manual note and avoid invented throughput claims. The baseline is not a benchmark for every machine. It is an experiment designed to answer one question about this computer and this workload under conditions the owner can recognize.
Separate memory use from a memory leak
A large process can be doing useful work. Compilers, analysis engines, and language tools may retain caches or allocate substantially during a complex operation. A leak claim requires more than one large sample: look for growth across comparable work, failure to release resources where release is expected, or a reproducible degradation tied to the same path. Even then, distinguish an implementation defect from intentionally retained state and from limitations of the measurement. The practical concern is whether the process prevents the intended workflow from continuing, not whether its number looks large beside a much smaller idle helper.
Record the sample's scope and the workload before choosing a remedy. Restarting a component can temporarily lower memory without fixing the underlying cause. If the condition returns, that pattern is useful evidence. Keep enough information to reproduce it without collecting unrelated private command arguments. A report might name the component, version, task class, observation interval, and approximate memory trend. It should not imply that a single screenshot proves a leak or that every large process should be terminated. A careful diagnosis can still justify a targeted restart while leaving the longer-term explanation open for investigation.

Understand disk measurements before clearing anything
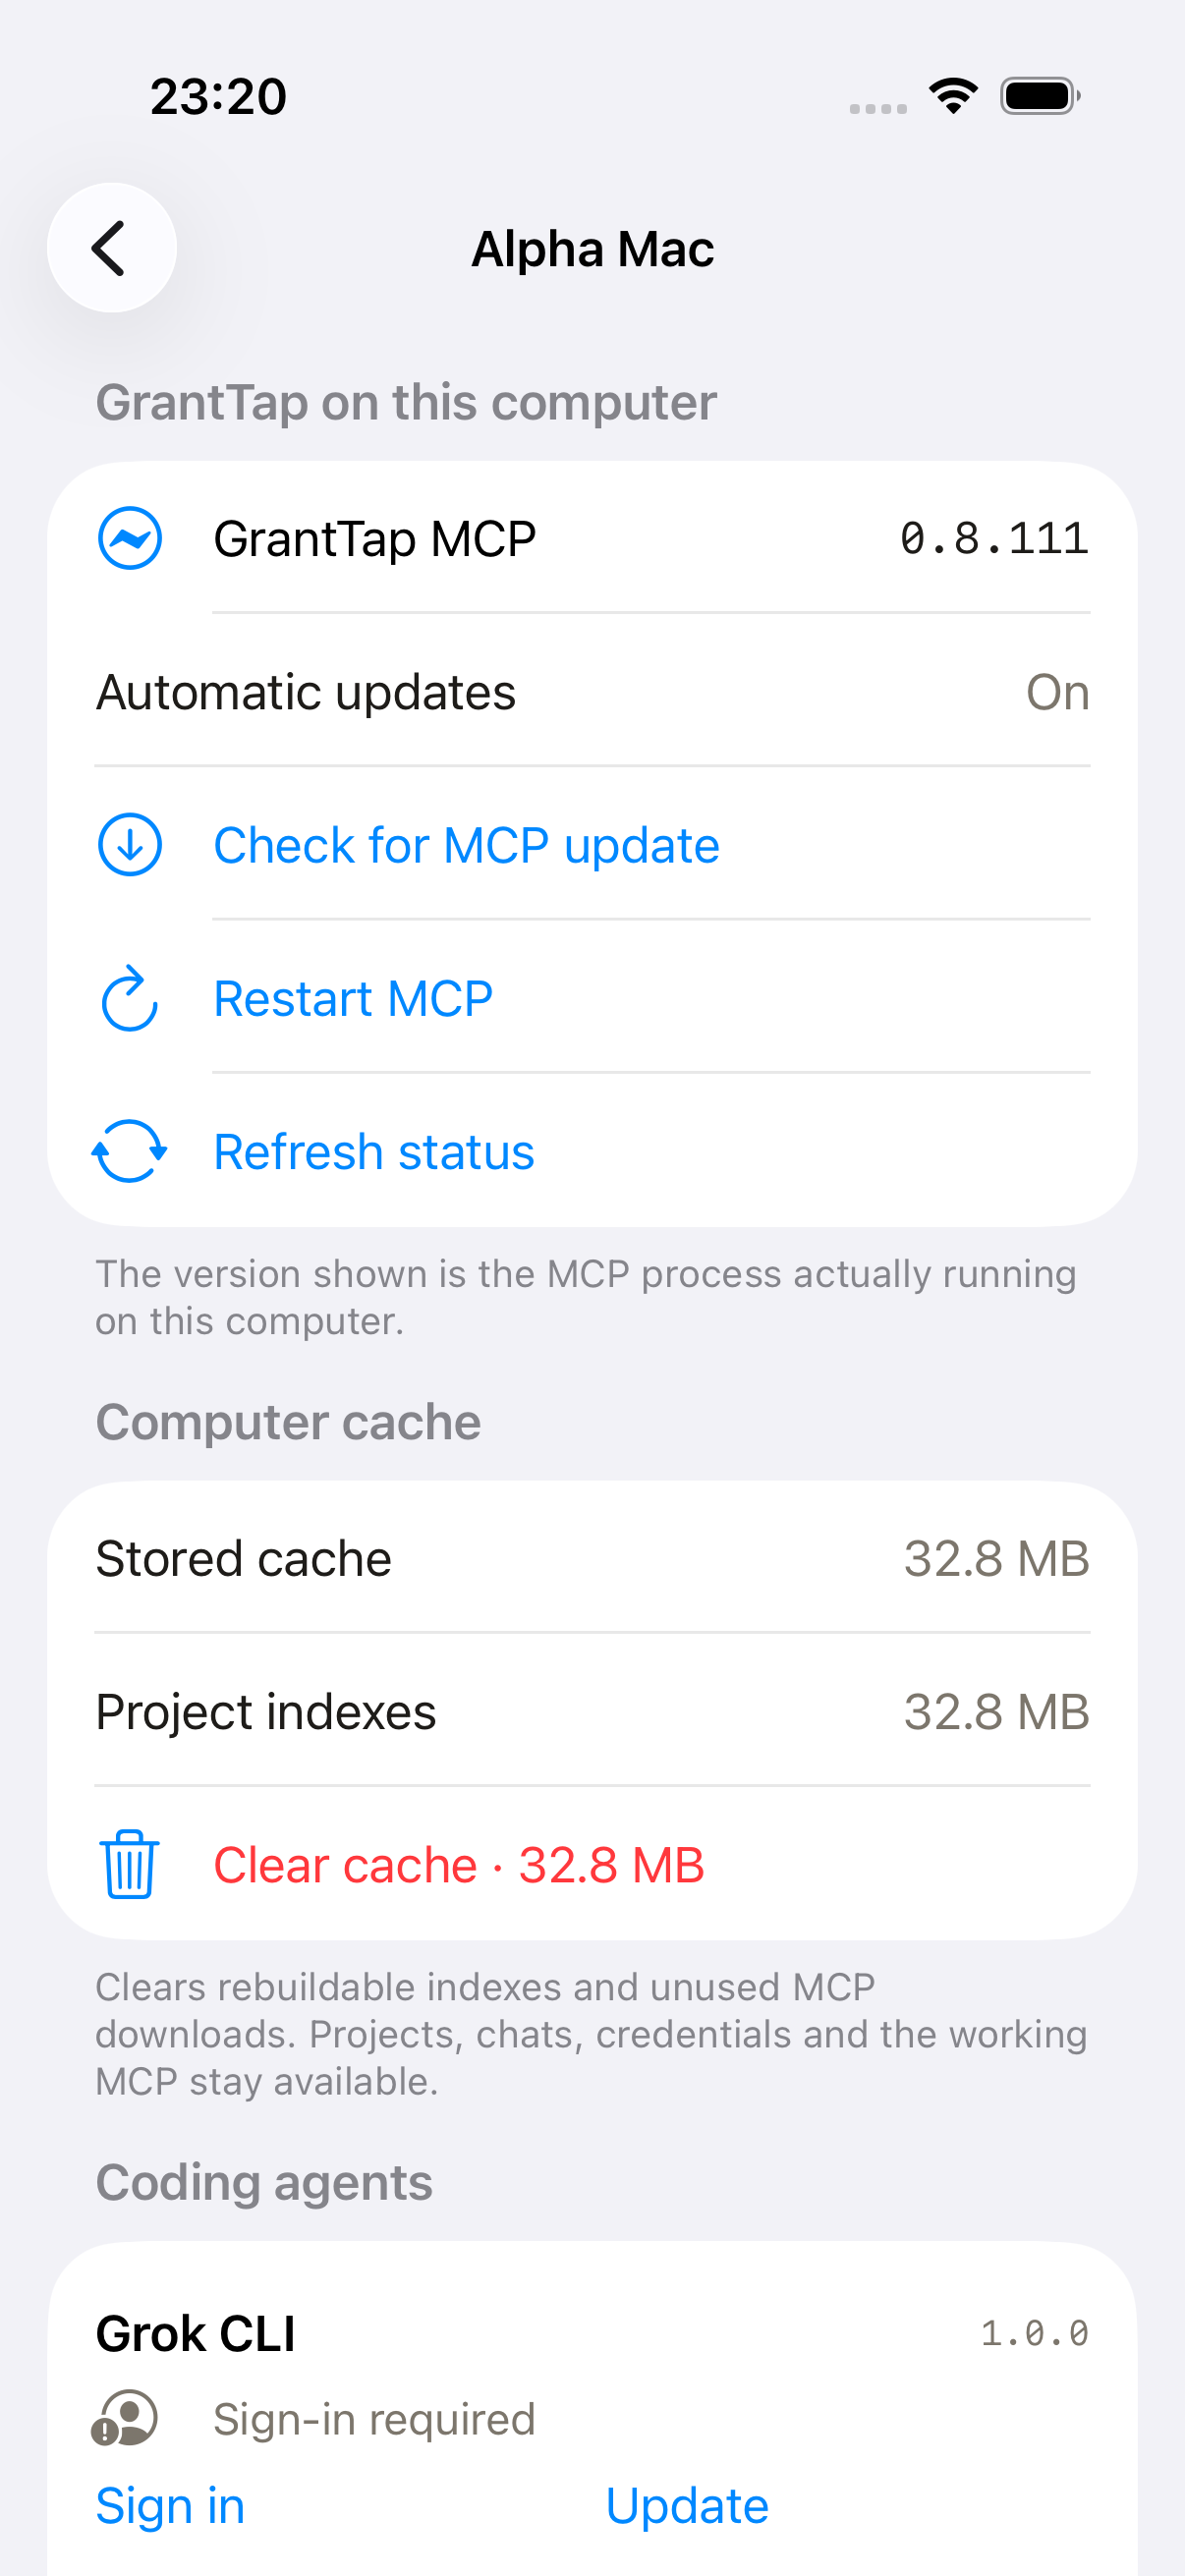
A provider's storage folder may contain history, configuration, credentials, and caches together. Its measured size does not authorize removing the entire folder. In GrantTap, phone chat cache and a computer's disposable MCP cache are separate surfaces. The computer cleanup action identifies rebuildable indexes and unused downloads that its runtime considers removable. Its reclaimable size can be smaller than total observed storage, because the working runtime and retained user data are not all disposable. Read the category and the confirmation instead of treating every displayed byte as a cleanup opportunity.
For build artifacts and virtual devices, use the owning tool's lifecycle and distinguish actively used resources from old disposable ones. Do not remove another project's archive merely because it is large or has an unfamiliar name. A task can clean up its own temporary build directory and sample simulator after preserving the requested deliverables. That is a different scope from deleting the owner's historic release materials. Low disk space may require deliberate broader maintenance, but the decision should identify which data is reproducible, who owns it, and what useful work would be lost if it disappeared.
Check installed and running versions separately
A newer MCP version on disk does not prove that the current process uses it. Device management distinguishes the running runtime from a selected update waiting for activation. An open coding app may also keep an older stdio process. Read the result of the update and, where required, use the supported restart path and wait for confirmation. This matters in a load investigation because you might be observing the old behavior while believing that a fix is already active. Keep the computer identity and the particular process role in the record when you compare before and after.
Provider tools have their own installation and update methods. Updating GrantTap MCP does not update every Claude, Codex, Grok, or Cursor installation automatically. The selected computer may detect several CLI copies, including one bundled by a desktop application. Do not assume that a version printed by a different terminal is the executable used by the active route. The product can report its detected tool and updater support; read that observation and its limitations. A successful update result should identify what changed. It is not a license to replace unrelated application processes or bypass a provider's own authorization requirements.
Use restart controls with the correct scope
GrantTap's provider restart concerns CLI work started through GrantTap for that provider. It is not a command to restart every unrelated desktop conversation. Restart MCP concerns the GrantTap connection and its supported runtime services. These operations can interrupt active work, so read the presented scope and the current request state before using them. If the purpose is only to obtain a fresh observation, Refresh status is the appropriate action. Repeated restarts do not solve a missing login, and they can make the original timeline harder to understand by adding reconnects and new process instances.
After a targeted restart, verify both the new state and the work that mattered. A process disappearing is not enough if its replacement cannot receive messages. A new version label is not enough if the intended task is now waiting on an unresolved approval. Confirm the owning computer's response, the relevant provider state, and a small safe operation where appropriate. Preserve any unfinished task or uncertain delivery rather than immediately resending it. The result should be a usable route with explained evidence, not merely a temporarily empty process list that looks quiet on a monitoring screen.
Connect load to delivery only when evidence supports it
A slow computer can delay processing, but not every delayed message is a CPU problem. The phone may still be uploading, the computer may be asleep, the provider may need authentication, or a task may be waiting for a native permission. Inspect the original operation's stages. Saved on relay and Received by computer are different acknowledgments; activity and a finished response are further observations. A process sample can help explain a busy interval only when its timing and owner match the delayed work. Do not use the presence of a large engine process as a generic explanation for every missing reply.
Likewise, a low CPU value does not prove that an agent is idle. A model request can wait on a remote provider, a tool can wait on storage, or a process can be blocked on a decision. The user-facing Working state should reflect relevant fresh evidence rather than a simplistic CPU threshold. When the evidence is incomplete, the right next step is a targeted status or conversation check. Sending the same message repeatedly creates more potential work and makes attribution less clear. Preserve the original message identity while you determine whether the route needs recovery or simply has a known reason to wait.
Keep automation and active work separate
A recurring schedule can explain repeated activity, but disabling future runs does not stop one already in progress. In a supported Codex task, Automations exposes existing schedules and their confirmed state. Pause controls subsequent launches. Use the active conversation's supported Stop action when the current turn needs to end, then verify its result. Do not create a new automation just to monitor an investigation unless the owner actually requested recurring work. A one-time diagnostic task can be followed in the current workflow without leaving another permanent source of background activity.
Record the schedule's computer and time zone when its timing matters. An apparent random burst may correspond to a legitimate recurring job on that machine, while a duplicated schedule can produce unnecessary overlap. Confirm the source rather than deleting a visible clock-shaped card and assuming the native schedule is gone. Editing and pausing should receive the computer's acknowledgment. If the operation is unconfirmed, refresh the original state before issuing another change. The desired outcome is a known set of future work and a clear treatment of any currently running task, not an ambiguous mixture of hidden schedules and abandoned processes.
Prepare a diagnostic report another person can use
A useful report names the symptom, computer role, relevant versions, intended work, observation interval, and largest reliably attributed process group. Include whether the load ended with the task, persisted after completion, or returned after a targeted restart. Add the original message identifier only when delivery is part of the problem and the reference is safe to share. Remove credentials, active codes, private paths, and unrelated command arguments. More raw output does not automatically produce better evidence. The report should let a maintainer understand the hypothesis and the conditions under which it can be tested.
Finish by distinguishing what changed from what remains unknown. Perhaps a disposable cache was cleared and the available space increased, while the reason for repeated CPU bursts is still under investigation. Perhaps a stopped sample simulator removed a known load, but a provider's history was intentionally preserved. These are useful bounded outcomes. Do not label the whole workstation optimized because one number fell. A trustworthy maintenance workflow keeps projects intact, stops only understood work, and verifies that the agent route still serves the user's task. That is a better foundation for reliable mobile control than a habit of terminating every process that shares a familiar name.