Evidence · · 7 min read
What agent usage metrics can prove—and what they cannot
Token counts, plan limits, tool calls, cost, and useful output are different measurements. Here is a more honest dashboard vocabulary.

Agent dashboards often put dissimilar numbers next to each other: tokens, messages, time, requests, tool calls, plan limits, and money. A rising line can look informative while leaving the reader unsure what was measured. One provider may report usage at a session level; another may expose a plan window; a third may provide runtime telemetry in a separate observability product. None of those numbers alone says whether a coding task produced a correct change. A useful dashboard begins by stating its unit, measurement source, time window, and missing data.
GrantTap's product boundary explicitly separates capability availability, policy, and confirmed usage. Unknown usage stays unknown. That is especially important when the app coordinates several providers with different reporting surfaces. Cortex Loom, a separate project, can be discussed in terms of evidence-aware context selection and token efficiency hypotheses, but a numerical savings claim requires a repeatable before-and-after benchmark. AWS AgentCore's observability documentation shows a broader cloud telemetry model with sessions, latency, errors, and token usage; its runtime metrics guide warns that telemetry can differ from authoritative billing. We checked these primary sources on October 3, 2026.
Count the thing that actually happened
A message sent to an agent is not necessarily a model request. A model request is not necessarily one tool call. A tool call may fail or be denied, and a command that ran can still leave the task unfinished. Therefore a dashboard should not use a single “activity” bar as a substitute for all of them. If it shows tokens, say whether they are input, output, or cached. If it shows calls, say whether they are proposed, attempted, completed, or confirmed by the host. If the integration supplies no reliable value, an empty or unknown state is more truthful than zero.
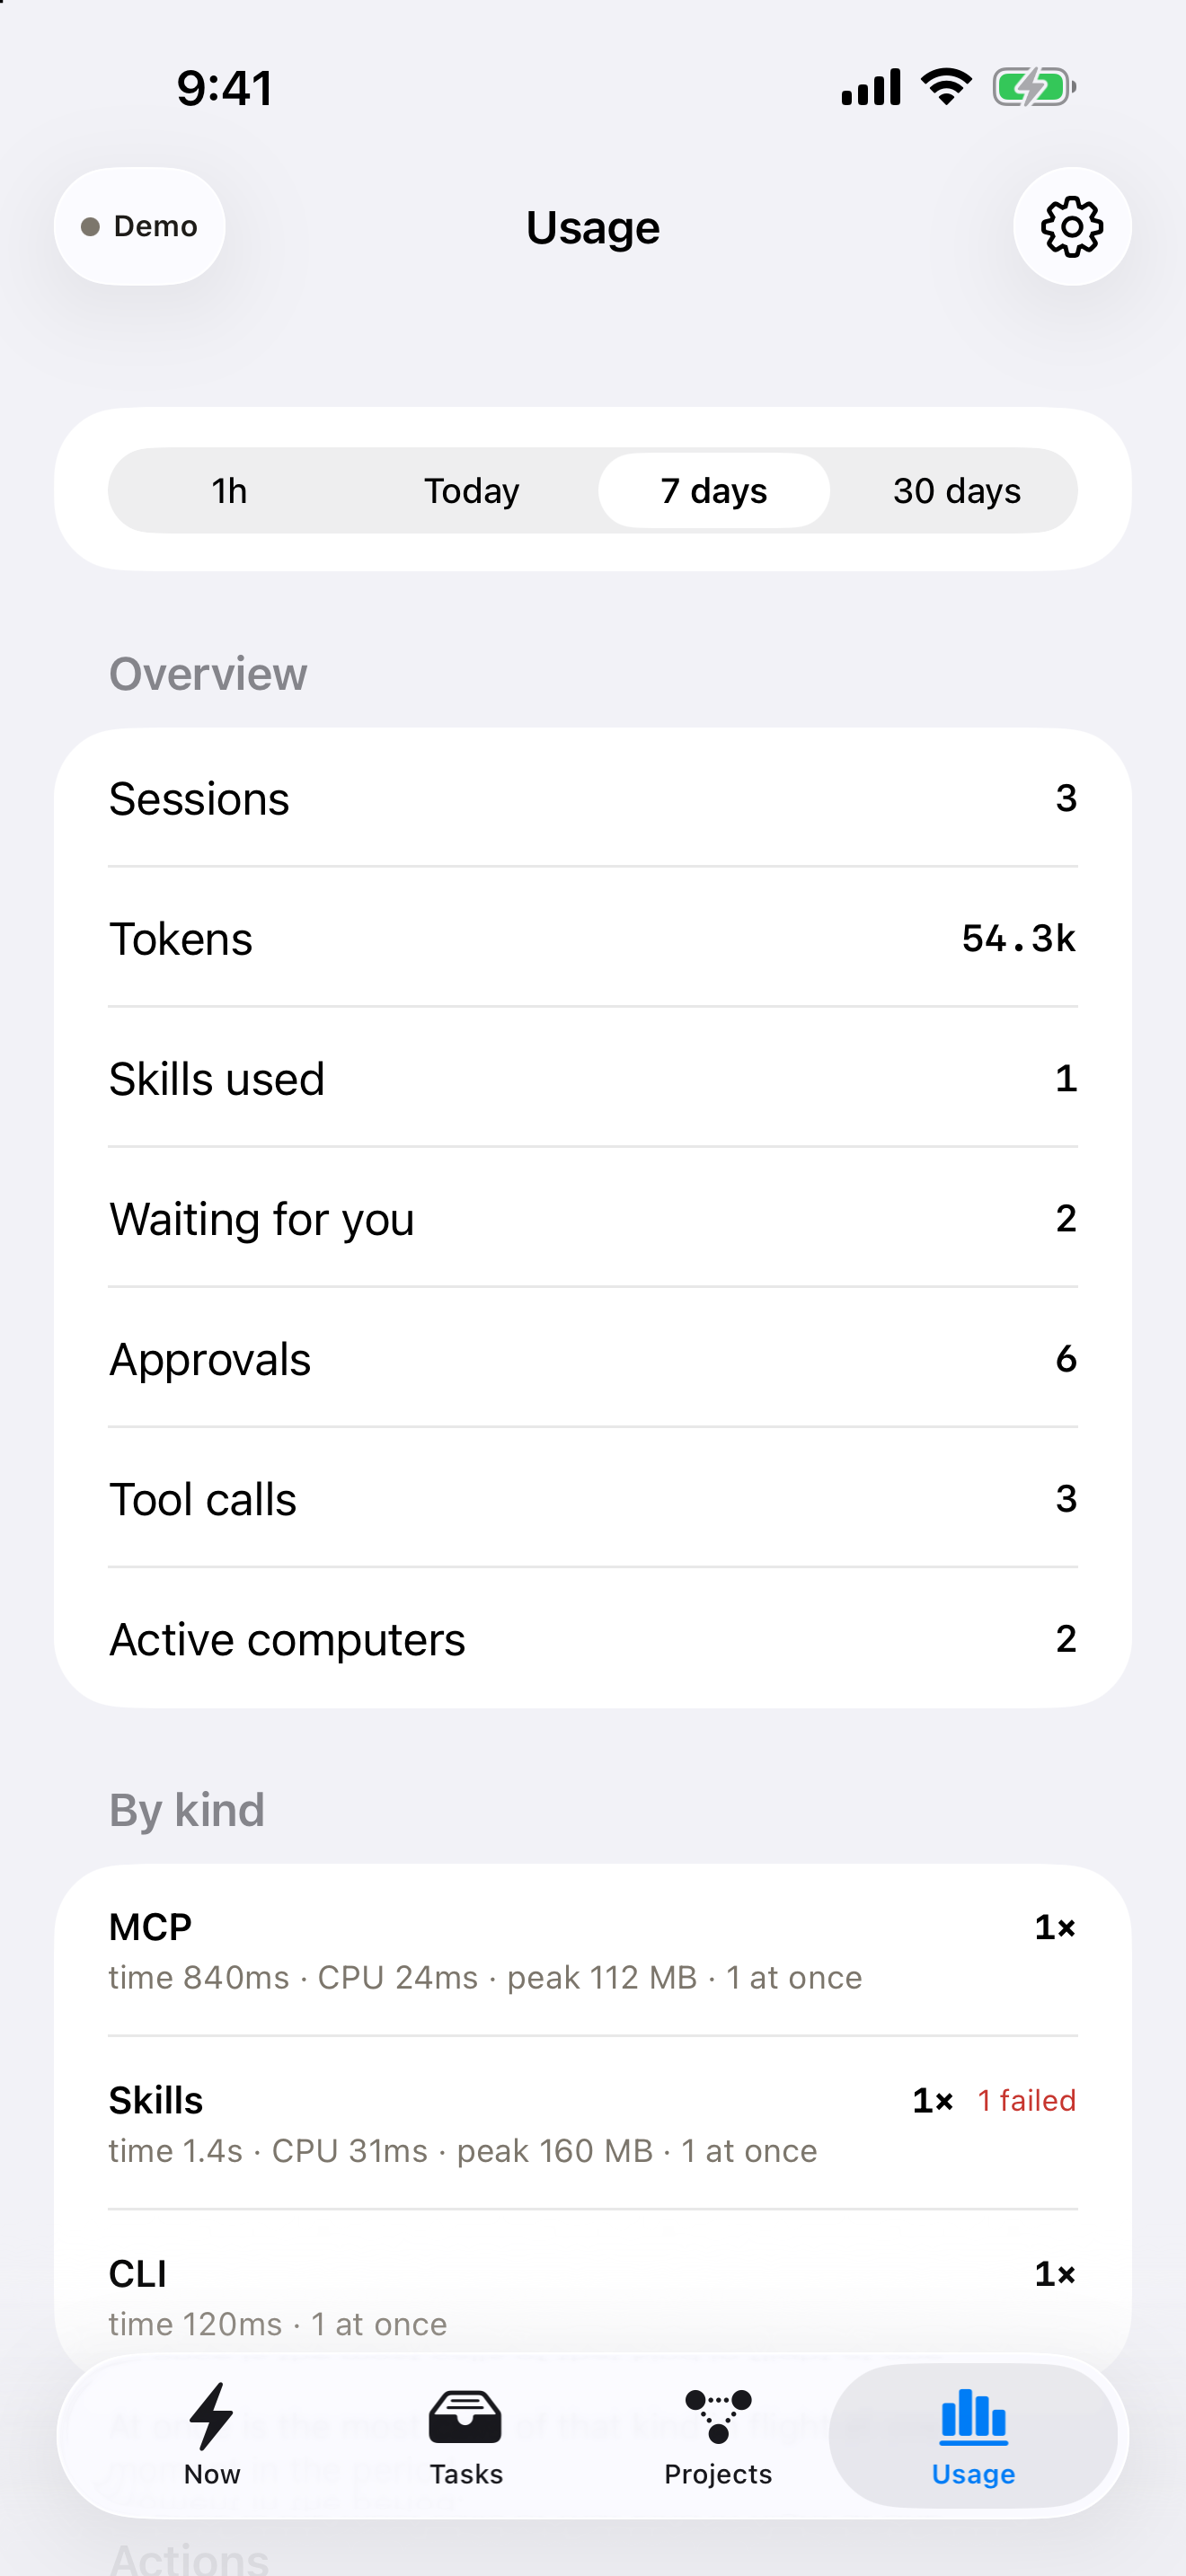
The screenshot below shows GrantTap's usage interface with deterministic sample data. Those values are fixtures, not measurements from a live customer or a claim of provider billing. A real observation must be traced to a source event or provider report. Attach the provider, execution, time window, and method used to collect it. When a Task includes multiple executions, avoid silently adding incompatible units. The same “one task” label does not make a Codex plan limit, Claude token count, and an AWS runtime invocation directly comparable.

Distinguish limits from consumption
A rate limit or plan allowance tells a user how much access remains under a particular account rule. It is not necessarily the number of tokens consumed by the current Task. A usage screen can help a person decide when to continue work, but it must label the account scope and reset window. A value may be stale if the provider has not refreshed it. A client that does not receive a limit should not infer one from a progress animation or a few recent sessions. This is the same epistemic discipline as reporting a disconnected computer as unknown rather than idle.
Cost estimates require still more care. Model pricing can distinguish input, cached input, and output tokens, and tool or compute charges may be separate. Provider plans can bundle usage in ways that do not map cleanly to public API prices. A calculation made from public token rates may be helpful for an experiment, but it is not an invoice. AWS's AgentCore runtime guide explicitly notes that monitoring telemetry may differ from billed usage because of timing, reconciliation, and precision. If a product shows a currency figure, it should state whether it is an estimate and point to the provider's authoritative billing surface for financial decisions.
Compare context strategies with a benchmark
Cortex Loom's idea of selecting evidence relevant to a Task rather than sending the whole repository every time is plausible as an efficiency strategy. Plausibility is not a percentage. To claim token savings, choose a fixed corpus of representative tasks, one model configuration, and a baseline retrieval method. Record input and output token counts, cache behavior, number of retries, tool calls, task success, and reviewer effort. Run the two approaches on comparable repository revisions. Include the cost of indexing and retrieval if the claim concerns total resource use, not just the prompt sent to the model.
A smaller prompt can be worse if it omits a critical file and causes multiple retries or a wrong patch. Conversely, a larger first prompt might reduce total work when it prevents repeated searches. Measure both quality and resource consumption. Report median and spread across tasks, not a single impressive example. Keep unsuccessful runs in the dataset. If the provider does not expose enough token accounting to make the comparison, state the limitation and use a narrower claim such as “selected fewer source files” or “reduced context bytes in this benchmark.” That language is less exciting but much more useful to an engineer deciding whether to adopt the technique.

Observability serves debugging as well as budgeting
AWS AgentCore Observability illustrates why a single token graph is incomplete. Its docs describe telemetry for sessions, latency, duration, token usage, error rates, and traces. Those signals help investigate a slow or failing agent even when cost is not the immediate question. For a coding workflow, the analogous evidence includes elapsed time, the commands attempted, tests run, failures, retries, and the exact revision produced. A high token count might reflect waste, a hard problem, or a thorough investigation. A low count might reflect efficiency or an incomplete job. The number needs the execution trace.
GrantTap's useful role is to keep such signals attached to the right Project, Task, and Execution where its integrations can observe them. It should not invent metrics for a provider that exposes none. A metric is strongest when the user can move from a card to the underlying event or provider source. If that link is unavailable, a label should explain that the value is reported rather than independently confirmed. This approach also prevents a capability toggle from appearing as activity: allowing a skill, accepting a prompt, and actually using a tool are three distinct events.
Build a dashboard that invites verification
For each number, add four small pieces of context: the unit, source, time window, and status of confirmation. Show unknown values visibly rather than filling them with zero. Separate plan availability from actual execution consumption. When comparing providers, use common outcomes only where they truly share a definition, such as “Task finished with named test passing on revision X.” Even that outcome needs the test log, because an agent assertion is not a test run. This is a product design constraint as much as a statistical one.
An effective weekly review can stay simple. Pick several completed Tasks and ask how many required retries, how much provider usage was reported, how much was observed locally, and which results passed independent checks. Then inspect cases where high usage delivered little progress and cases where low usage hid missing work. Use the findings to adjust context selection, task scope, or approval rules. Do not optimize solely for the smallest token count. The aim is a trustworthy result per unit of effort, with enough evidence for a human to challenge the story the dashboard tells.